🟢 Featured Service

Performance Testing & Engineering

Eliminate slow load times and crash errors before your users experience them. We execute realistic traffic simulations and carry out rigorous stress tests to ensure your digital systems scale seamlessly under heavy concurrent user loads.

99.99%
System Uptime Assured
3x
Latency Reduction
5M+
Simulated Users
8+
Years of Experience
Performance Testing Services — JLD Info Tech
Apache JMeter k6 (Grafana Labs) Gatling Locust Blazemeter NeoLoad Grafana Prometheus InfluxDB AppDynamics Dynatrace New Relic LoadRunner CI/CD Pipelines Apache JMeter k6 (Grafana Labs) Gatling Locust Blazemeter NeoLoad Grafana Prometheus InfluxDB AppDynamics Dynatrace New Relic LoadRunner CI/CD Pipelines

Ensure Fast Page Speeds. Keep Users Engaged.

Your software speed is directly linked to your business revenue.

Slow page load times and sudden system crashes can drive valuable users directly to your competitors. At JLD Info Tech, we move beyond simple post-development checks to build a complete performance culture, identifying hidden system memory leaks, resource deadlocks, and slow database queries before they hurt your users.

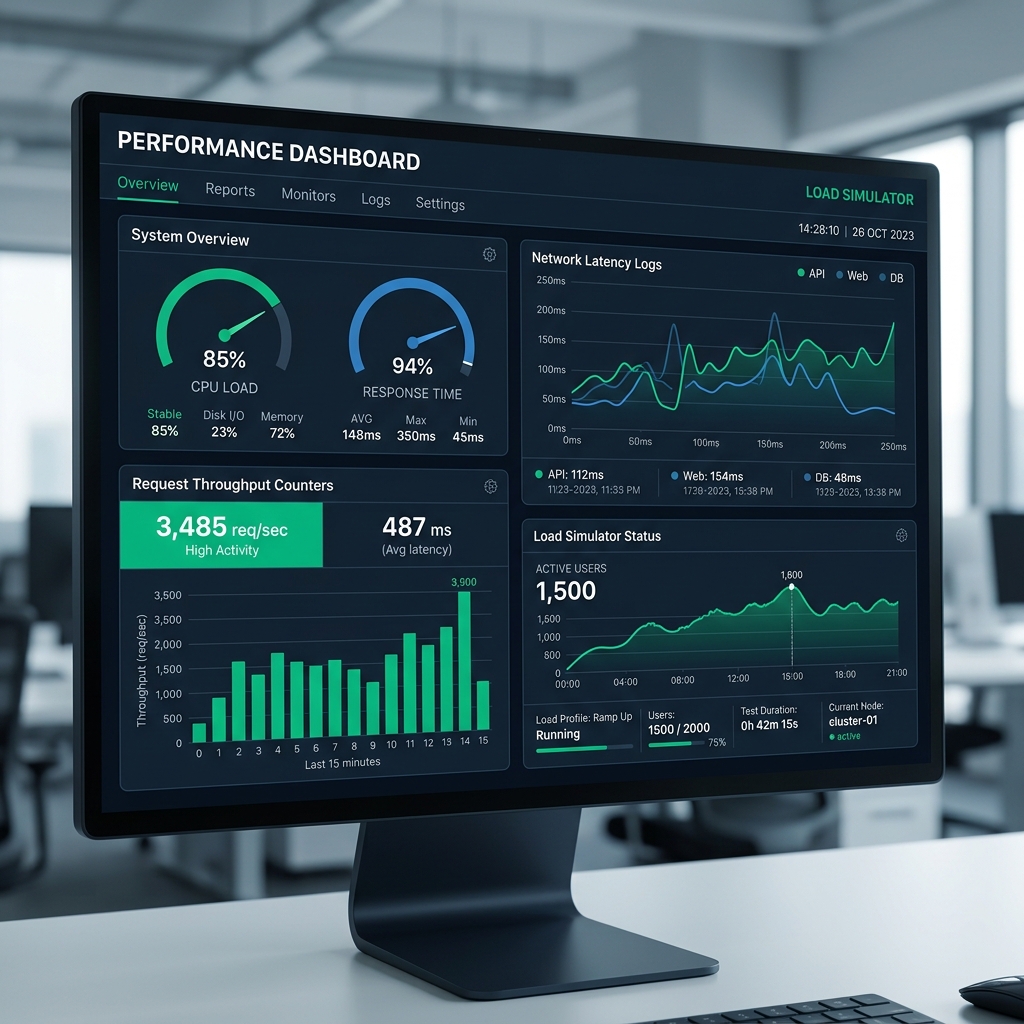
We configure realistic, distributed client workloads mimicking actual human traffic behavior, pinpointing the hardware boundaries of your infrastructure and helping you optimize server costs.

  • Accurate traffic simulation using distributed testing cloud nodes
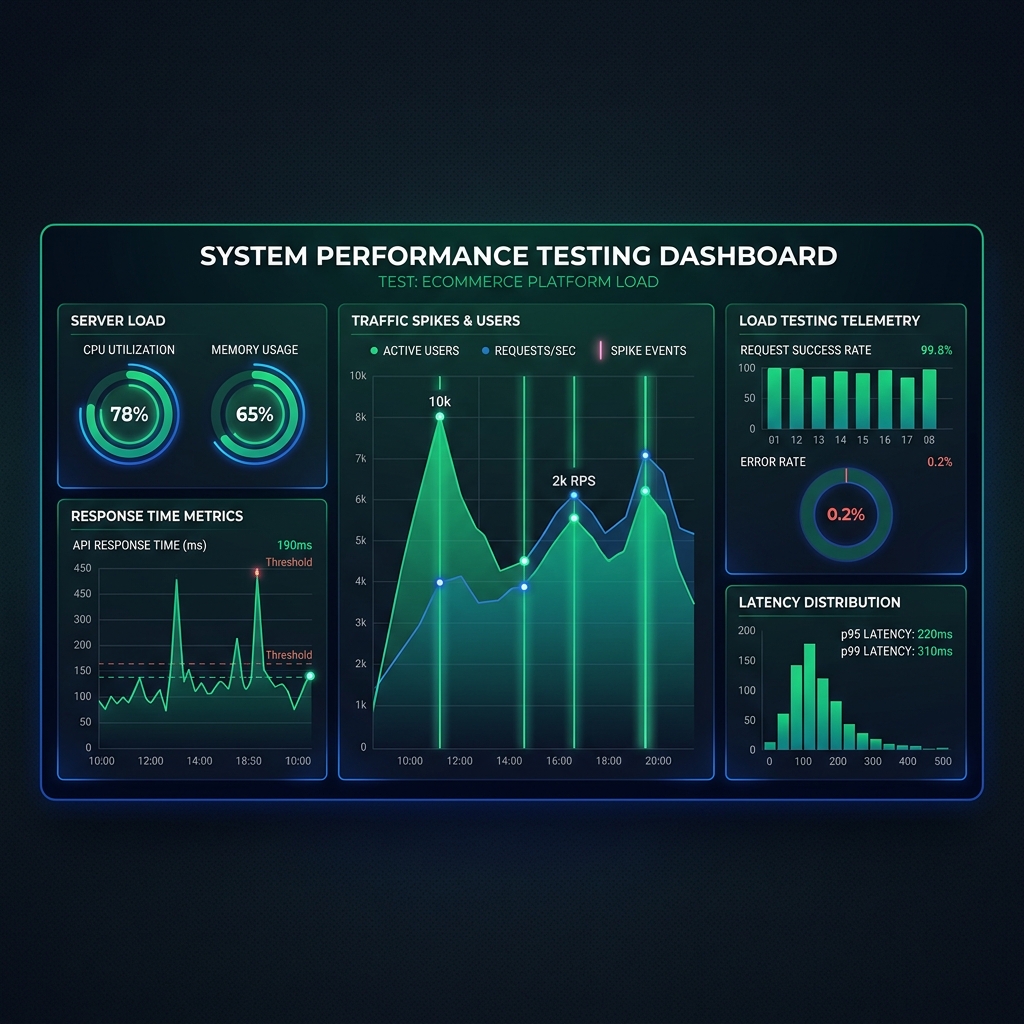
  • Detailed monitoring of server resources (CPU, Memory, Disk, Network I/O)
  • Database transaction profiles and query efficiency analytics
  • Memory leak detection and thread safety evaluations
  • Integration of automated smoke and load checks in CI pipelines
  • Actionable reports mapping system limitations and scalability boundaries
Begin Performance Audit → Our Methodology
Performance Testing Dashboards — JLD Info Tech

Comprehensive Load & Stress Engineering

We use robust load simulators to evaluate every tier of your application—ensuring the frontend, API gateways, database, and background workers scale smoothly together.

📈

Load Testing

We simulate expected, standard user traffic counts to verify response times, check server utilization ratios, and guarantee that your application complies with your specific Service Level Agreements under normal workloads.

SLA Verification Traffic Simulation JMeter k6
💥

Stress Testing

We push your digital systems past standard traffic expectations to find the exact breaking point. We analyze how gracefully the application fails under extreme loads and verify if it recovers cleanly when user traffic drops back down.

Breaking Point System Recovery Gatling High Concurrency

Endurance & Soak Testing

We execute long-duration traffic scenarios (lasting several hours to days) to uncover persistent issues such as memory leaks, database connection pool exhaustion, file system storage limits, and system fragmentation.

Memory Leak Search Stability Check Long-run Loads Resource Leaks

Spike Testing

We generate massive traffic surges in a matter of seconds (like flash sales or viral news occurrences) to test if your autoscale configurations trigger quickly enough and ensure your API gateways do not reject valid clients.

Autoscale Audit Flash Sales Concurrency Spikes Queue Check
📦

Volume & Database Testing

We populate your databases with millions of test rows and evaluate system behaviors under heavy data read/write transactions. We locate unoptimized database tables, locked rows, and slow index execution paths.

Big Data Loads Database Tuning Query Analysis Transaction QA
📐

Scalability & Cloud Audit

We verify system behavior when adding or removing server nodes. We review if the load balancers distribute connections properly and validate that cloud resource costs scale linearly with user growth.

Load Balancers Autoscale Rules Cost Efficiency Cloud QA
Success Metrics

Real Performance. Guaranteed Results.

Our performance engineering teams helped an enterprise e-commerce customer optimize their infrastructure layout, reducing response latencies by 60% and successfully handling a peak spike of 120,000 active concurrent buyers without single-page slowdowns.

Get Your System Reviewed
Performance Analytics Metrics — JLD Info Tech

A Systematic Path to Optimized Performance

Performance testing is not just about running a script and checking a graph. We apply a rigorous engineering lifecycle that isolates bottlenecks layer by layer, delivering concrete data alongside specific code and configuration fixes.

01
📋

Identify Performance Targets

We work with your teams to map key transactions, set realistic response time targets, define peak concurrent user counts, and review existing metrics logs.

02
📝

Script & Scenario Design

We construct realistic user paths in tools like JMeter or k6, avoiding dynamic caching issues to ensure test traffic matches actual client behaviors.

03

Test Execution & Monitoring

We run distributed tests from multiple cloud regions while monitoring target system behaviors using APM tools and infrastructure metrics collectors.

04
📊

Bottleneck Isolation & Fixes

We analyze the logs to locate slow processes, CPU bottlenecks, memory leaks, and network queues. We provide precise code or setup adjustments.

05

Verify & Establish Baselines

We run comparison load tests to verify the performance changes, document the new capacity baselines, and configure smoke tests in your deployment pipeline.

Free Initial Server Review

Unsure of how much traffic your current setup can handle? Get a basic performance evaluation. We'll run a quick load simulation on your staging environment and highlight obvious resource bottlenecks.

Request Staging Scan →

Industry-Standard Testing Tools

We utilize leading open-source and enterprise performance utilities, choosing the best fit for your team's deployment workflow.

Highly Custom, Protocol-Rich Load Testing

Apache JMeter is the industry standard for traditional protocol testing. It supports diverse messaging structures and excels in validating web applications, SOAP/REST APIs, database queries, and custom file systems.

🌐
HTTP/HTTPS
🔌
SOAP/REST
🗄️
JDBC/SQL
📦
JMS/MQ

Modern developer-centric Javascript Scripting

k6 by Grafana Labs is built for clean automation pipelines. Written in Javascript, it offers minimal CPU utilization per virtual client, integrates with monitoring stacks, and is perfect for modern code-first engineering teams.

💻
Javascript
🚀
CI Pipelines
📊
Prometheus
📈
Grafana Cloud

High-Throughput Scala & Java Testing

Gatling utilizes Scala or Java scripts alongside an asynchronous architecture, enabling it to simulate enormous volumes of concurrent connections with minimal system resource footprint. Perfect for high-concurrency stress test requirements.

Java/Scala
Netty Engine
🌐
WebSockets
🔄
Akka Engine

End-to-End System Dashboard Visualizations

Running a load test is useless without real-time metrics logs. We integrate systems dashboards to capture exact hardware utilization, garbage collection occurrences, application errors, and database queue delays.

📊
Grafana
📡
Prometheus
🔥
Dynatrace
☁️
New Relic

The Cost of Slow Performance

Unoptimized software performance costs more than just CPU cycles. It impacts marketing efficiency, brand trust, and user conversions. Compare the difference between basic deployments and JLD Performance Engineering.

System Metric Minimal QA Check JLD Performance QA
Average Page Load Time ❌ 4.8 seconds ✓ Under 1.5 seconds
Stability during Traffic Surges ❌ High Error Rates (503s) ✓ Clean Autoscale, 0% Errors
Infrastructure Cloud Costs ⚠️ Oversized & Expensive ✓ Fine-tuned & Cost-efficient
Memory Leak Detection ❌ Hard to locate (crash risks) ✓ Isolated via Soak Testing
Database Query Speeds ⚠️ Locked processes under load ✓ Indexed, optimized queries
Performance engineering reports — JLD Info Tech
Performance testing across industries — JLD Info Tech

Tailored for Every Traffic Profile

Different sectors experience unique load profiles. We design custom load profiles mapping exactly to your industry's peak usage patterns, compliance standards, and critical endpoints.

🛍️

Retail & E-Commerce

Simulating flash sales, cart checkout loads, and catalog searches to ensure uptime during high-revenue shopping spikes.

🏦

Banking & FinTech

Testing secure REST APIs, transaction processing layers, and backend ledgers for absolute data precision under load.

🏥

Healthcare Portal systems

Verifying secure telehealth streaming reliability, patient record access, and high-concurrency file processing speeds.

🚗

Automobile & Fleet Logistics

Simulating real-time vehicle telematics telemetry streams, geospatial queries, and API push notifications under load.

What Optimized Speed Accomplishes

Speed is not just a technology metric—it directly impacts user experiences, user retention rates, and search rankings.

📈
74%

Higher User Retention

Users abandon sites loading slower than 3 seconds. Fast loads directly boost visitor conversion and retention rates.

💰
35%

Cloud Cost Reductions

By isolating slow code paths and memory usage leaks, we help clients run on smaller, cheaper cloud instances.

🔍
Top

Improved Search Rankings

Core Web Vitals are primary search engine ranking factors. Fast page load speeds translate to increased organic search traffic.

Frequently Asked Performance Questions

Find answers to common questions about load testing, stress simulations, server resources, and tools.

Performance engineering FAQ — JLD Info Tech
When in the development lifecycle should we run performance testing?
+
Performance testing should begin early. We implement small-scale automated API load checks during initial sprints, scaling up to full system-wide stress tests and soak evaluations in staging environments before major releases.
What is the difference between Load Testing and Stress Testing?
+
Load testing simulates standard user traffic ranges to verify the application stays within standard SLA boundaries. Stress testing pushes the system past its expected limits until it breaks, identifying vulnerabilities and system recovery limits.
Do we need to test on our production environment?
+
We typically test on an identical staging environment to prevent user disruptions. If production testing is required, we schedule runs during off-peak hours and use distinct test accounts to keep data logs clean.
What metrics are captured during load simulations?
+
We capture client metrics (response latencies, error ratios, connection timeouts) and backend server metrics (CPU usage, memory allocation trends, network interface speeds, database disk read/write logs, connection pools).

The JLD Info Tech Performance Edge

We are a dedicated QA and technology solutions company. We go beyond executing script scenarios to review configurations, rewrite query paths, and help optimize systems architecture.

Distributed Simulation Capacity

Generate millions of simultaneous request flows from multiple worldwide locations for accurate load reviews.

Infrastructure Cost Reduction Focus

Optimize application code logic so you can scale back servers, saving on cloud bills month after month.

Deep Code-Level Diagnostic Logging

We isolate the exact database rows or methods causing delays, rather than just reporting general crash ratios.

Our Tracking Record

Helping companies build stable, highly performant digital applications under any concurrent user load.

120K+
Peak Sim User Spikes
60%
Avg Response Speed Boost

Ready to evaluate your system's limits? Request a comprehensive performance audit and server load review today.

Get Started Now →

Ensure Software Reliability. Start Load Testing.

Get a free 30-minute system load strategy review with our engineers. We'll identify clear bottlenecks in your architecture and show you how to optimize capacity.